
Data Explained
Last week we rolled out with some 2024, Quarter 4 data sheets. This was a key milestone after a lot of trialling ways of how to present the numbers we are able to get access to and be able to read them in a relevant context.
Being the first rollout we still have data points that need to flow into that process but we are a long way towards that now and this week a lot of you will contribute to our dataset by doing some “testing”.
The Dose : Response Model
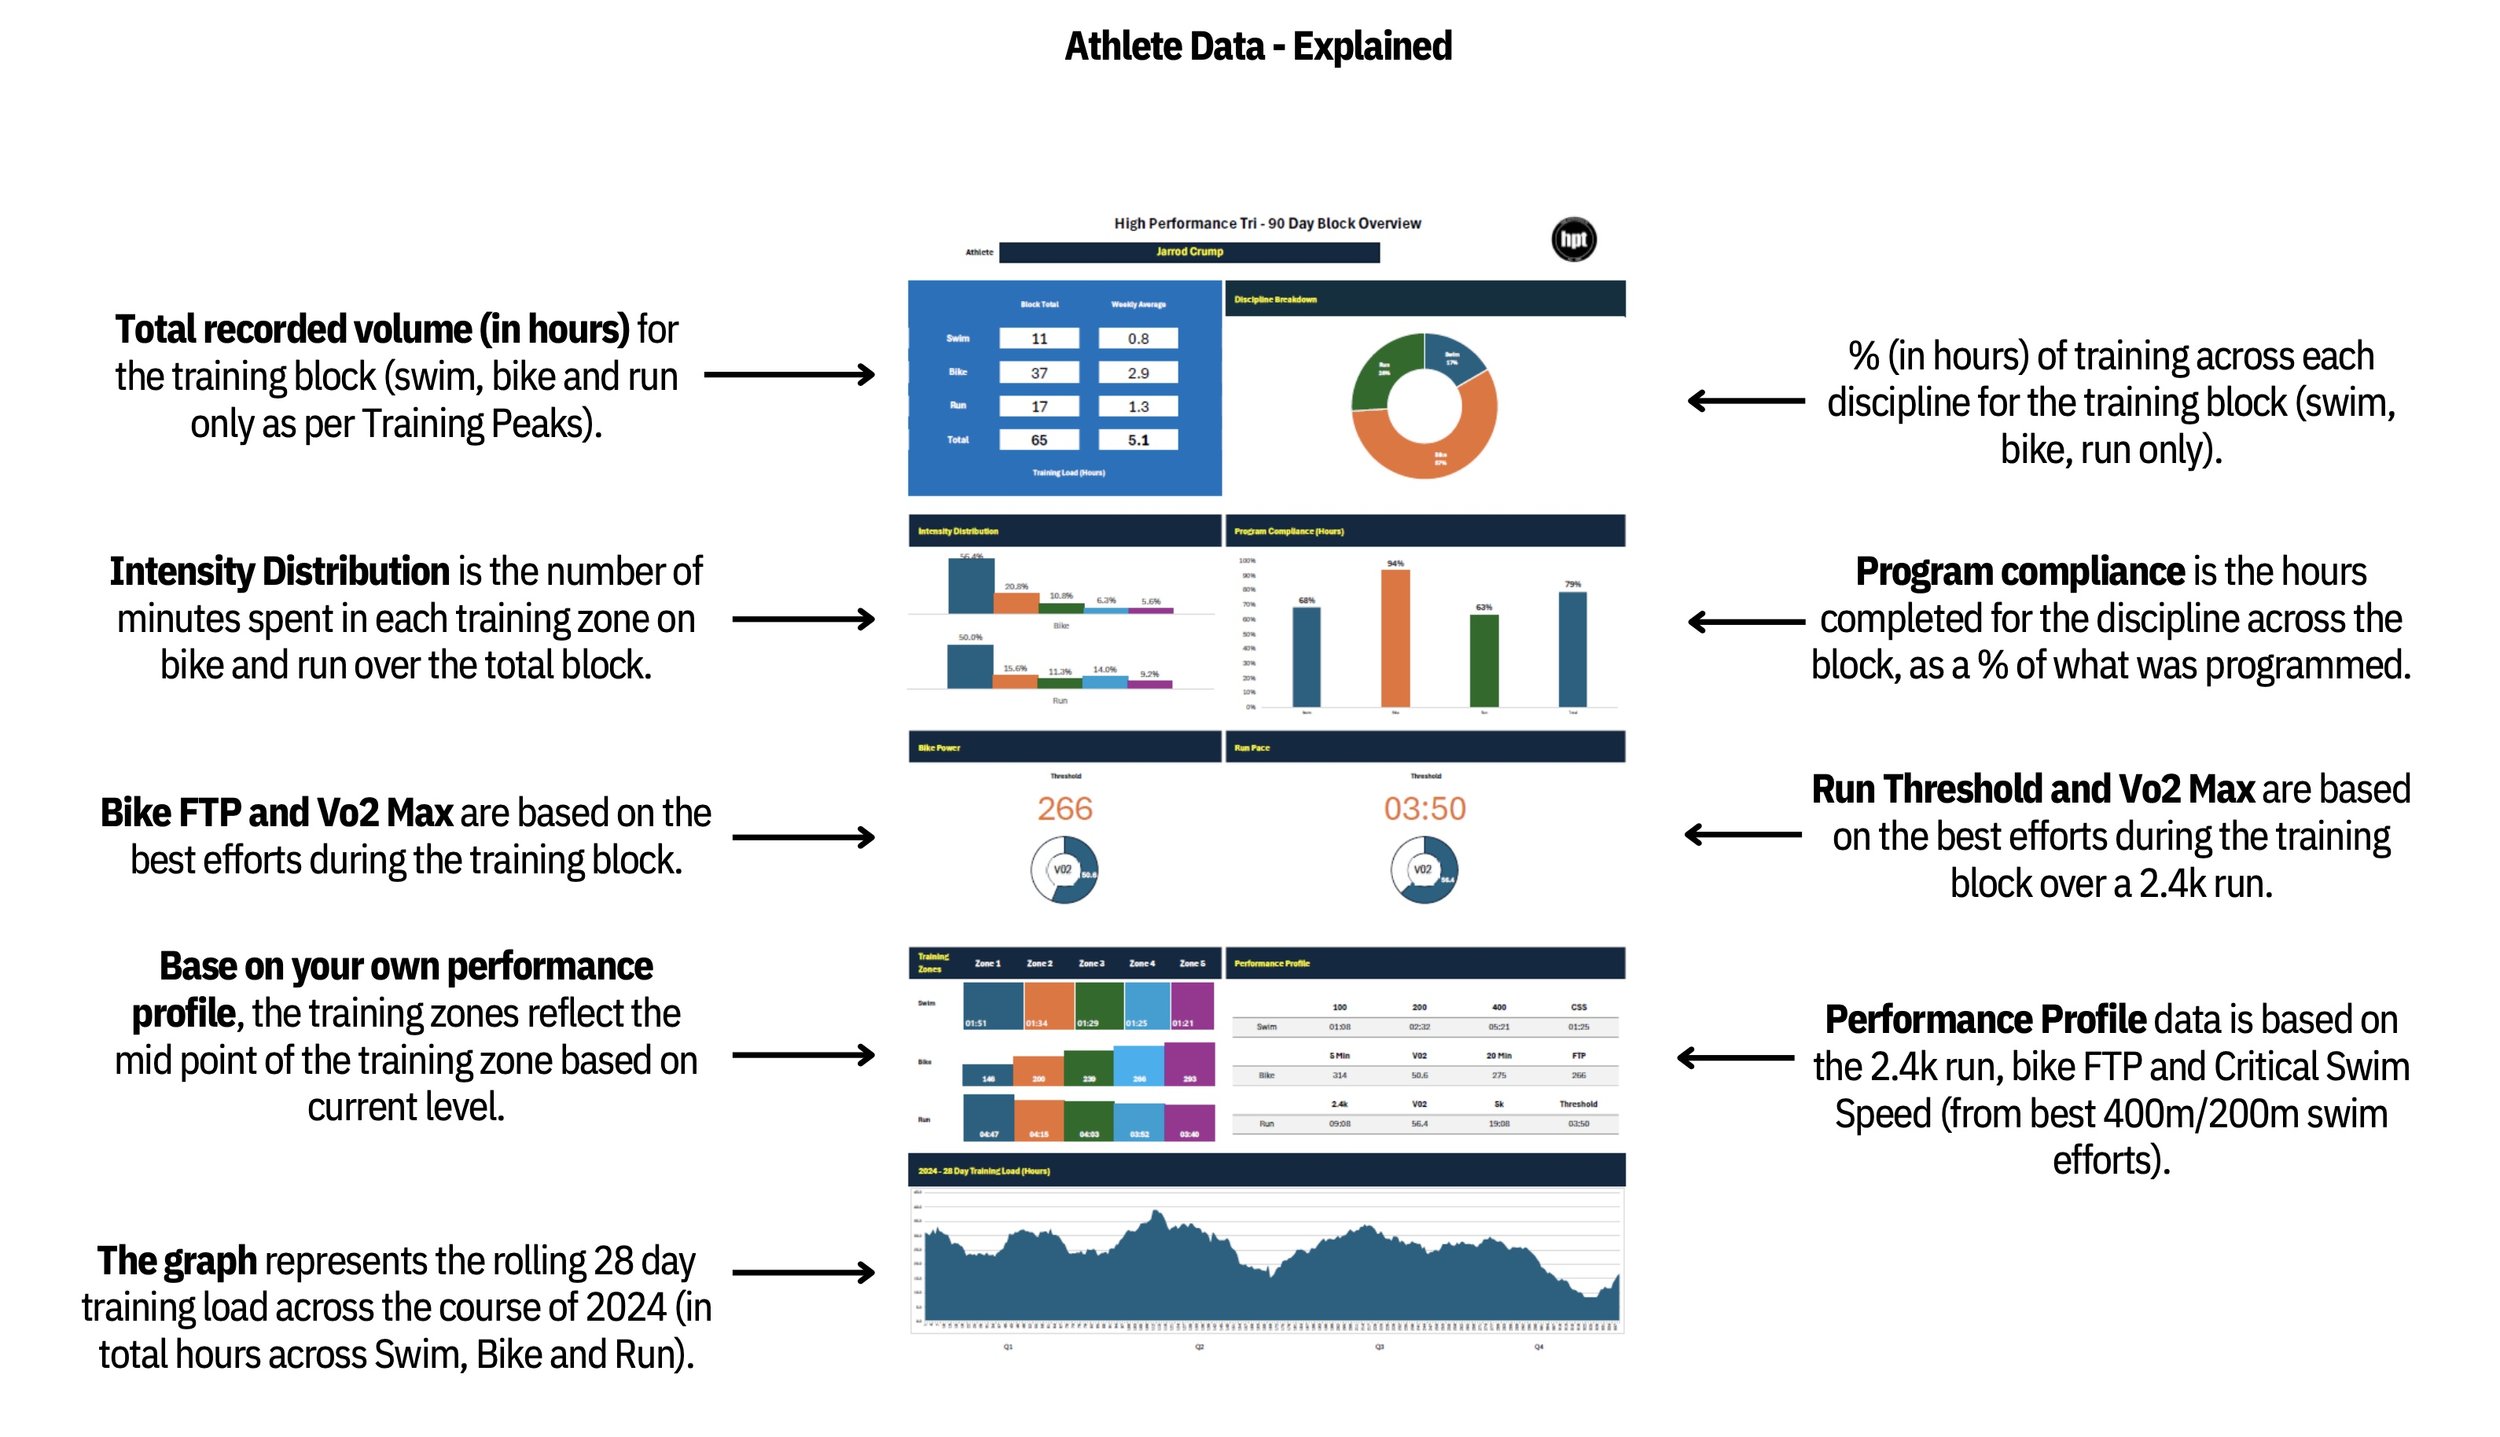
Above is a great explanation sheet compiled by Crumpy that will explain the different areas in more detail but the major ethos of what we are doing is providing a look at the dose : response model. What the training dose was and what the response is to that training.
Dose
You will see the training dose as hours in the quarter and a per week average. You will also see it expressed in percentages of overall training hours per discipline as well as the breakup of training intensity distribution.
Response
Looking specifically at the Performance Profile area this represents where you currently stand in terms of performance over a 3 point profile.
Reading and Using it
Obviously we are trying to improve performance. So look at the performance profile and try to identify (with the coach’s help) areas that will lead to improvement.
If a number isn'‘t budging then look at your training dose. Was it down last quarter? Was your program compliance in that discipline down? Use those numbers to identify issues and then be informed by facts.
Even Crumpy used his own numbers in this process to improve his bike. He knew he was struggling on the bike a little, took one look at his numbers and with those facts set a task of getting better compliance numbers which has improved his bike quite quickly.
What’s Next
Firstly, we want to get a deep data set that will make sure there are no blanks. That’s hugely important.
Next will be establishing a process as to how we deliver these reports, when we deliver them, and how we as a coach / athlete team can interact with them.
After that I want to produce a set of normative data “ranges” that athletes can gauge off. Similar to a blood test for example. You might have trained 145 hours in a quarter. We feel it would also be helpful to have a range of normative data for athletes of a similar level doing a similar race distance to you. We could present this as 145 (130-180)
Lastly, we want to find an accurate way of including other sports in the report such as Kayak or rowing etc.
We hope this helps. Your feedback has been invaluable so far as the types of questions being asked so please keep it coming.